See it in action
Dashboards designed for clarity under pressure
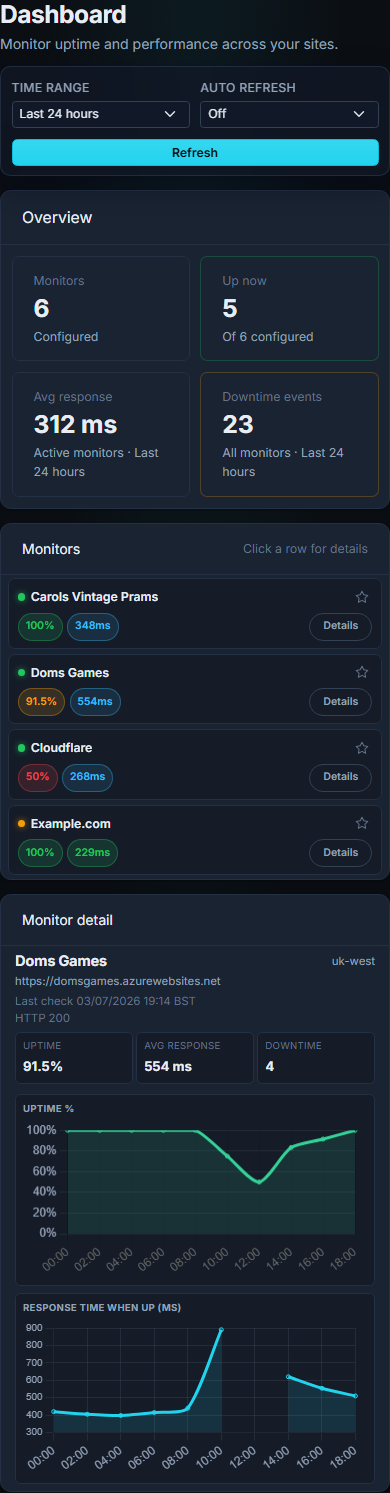
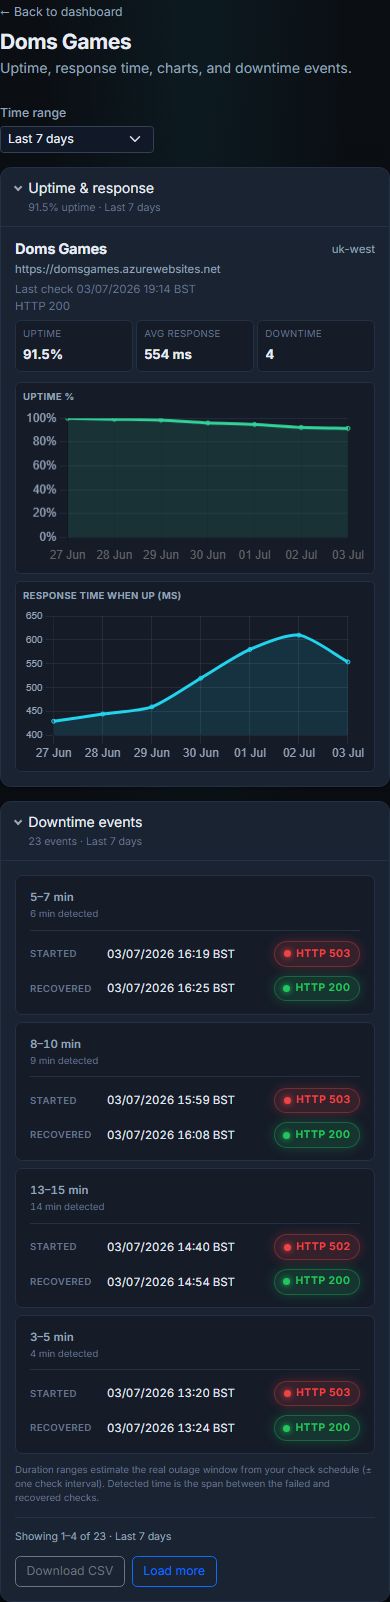
Web Status Raven brings KPI cards, live charts, monitor drill-down, paginated downtime history,
and CSV export into one polished workspace- so you can triage outages without digging through logs.
KPI summary cards
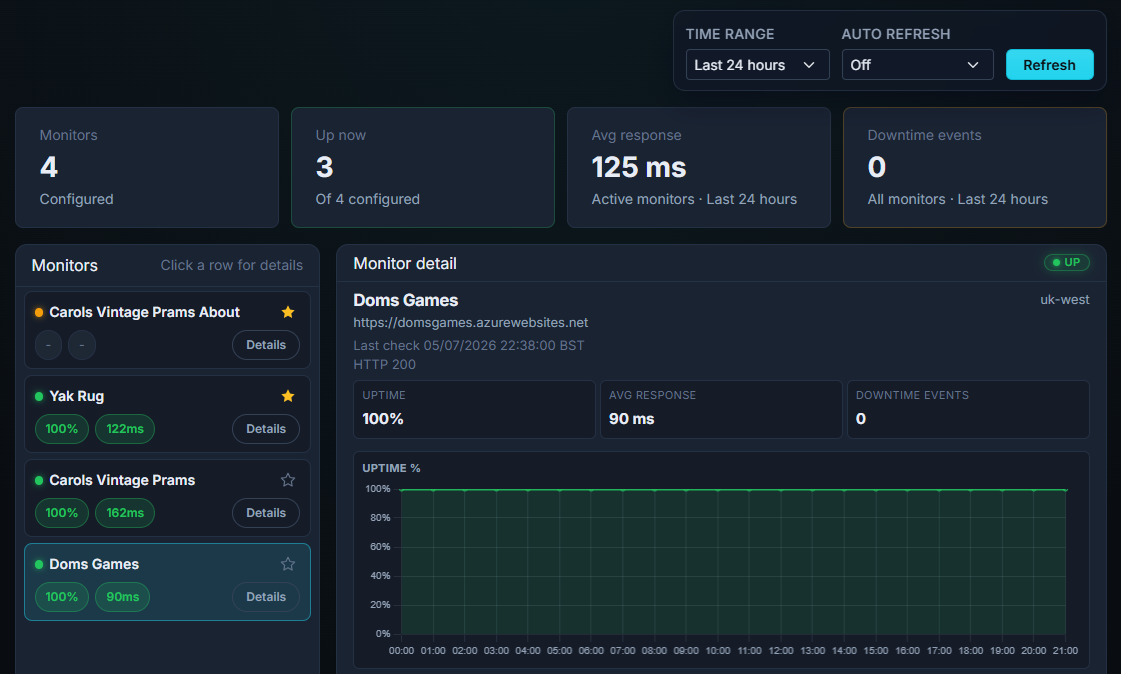
Monitors up, average response, and downtime counts at a glance for your selected time range.
Uptime & response charts
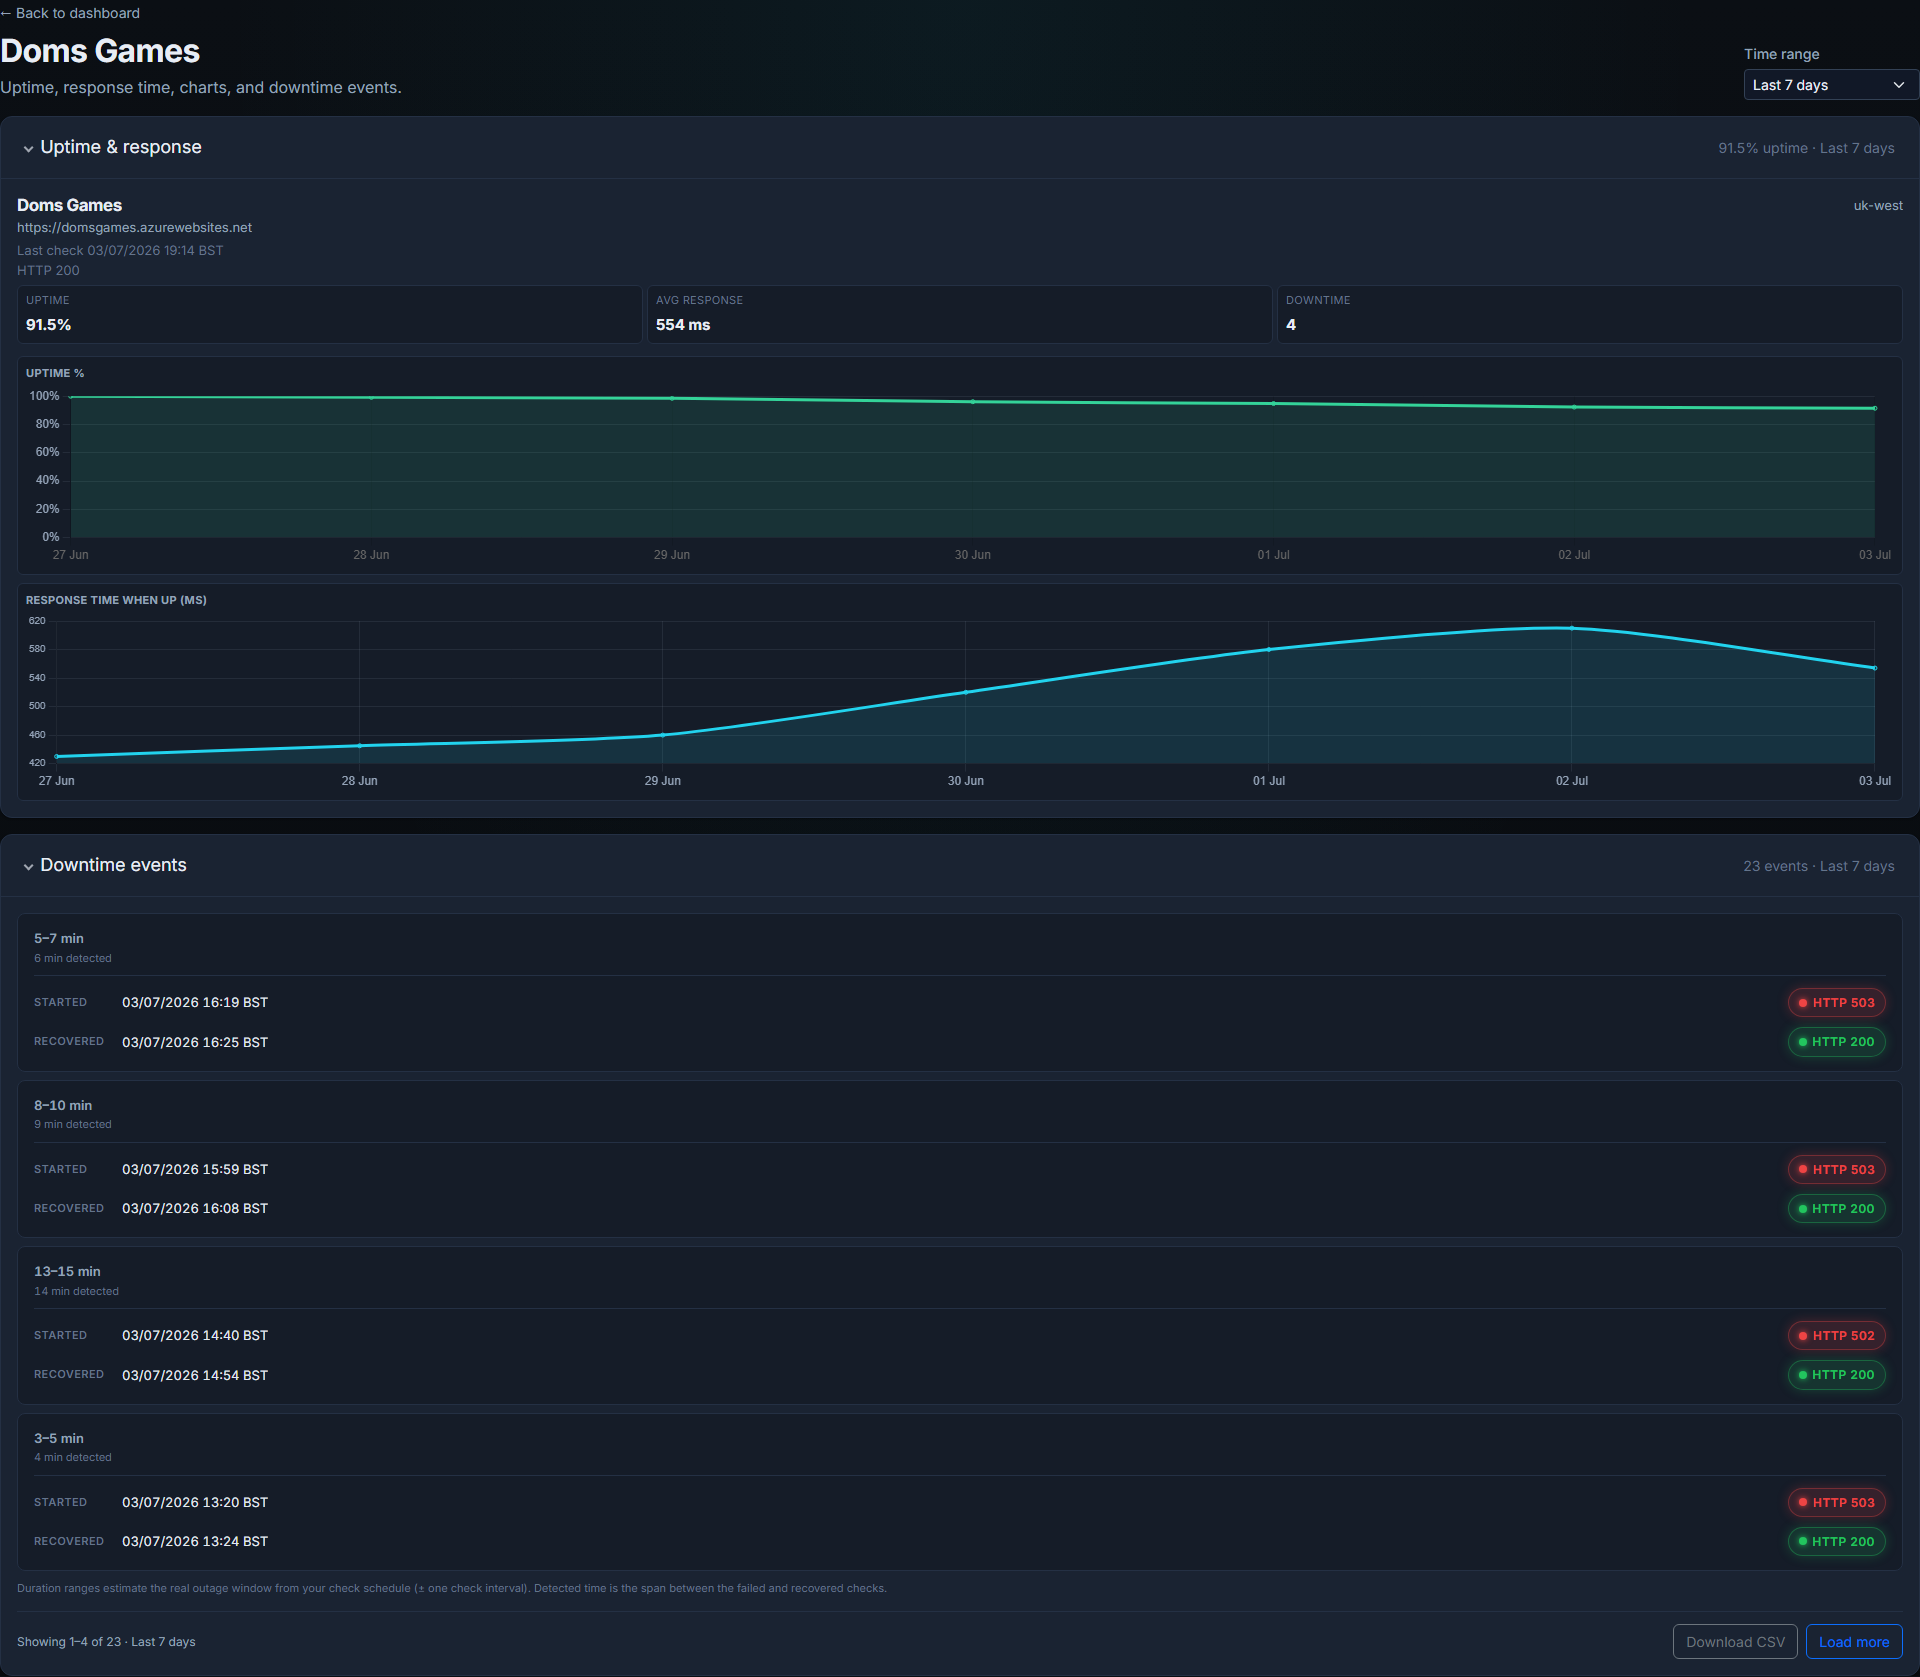
Stacked line charts with hourly or daily rollups from 24 hours to 30 days, depending on plan.
Monitor list with metric pills
Colour-coded uptime and response pills show health at a glance; click any monitor to drill in.
Live current-hour panel
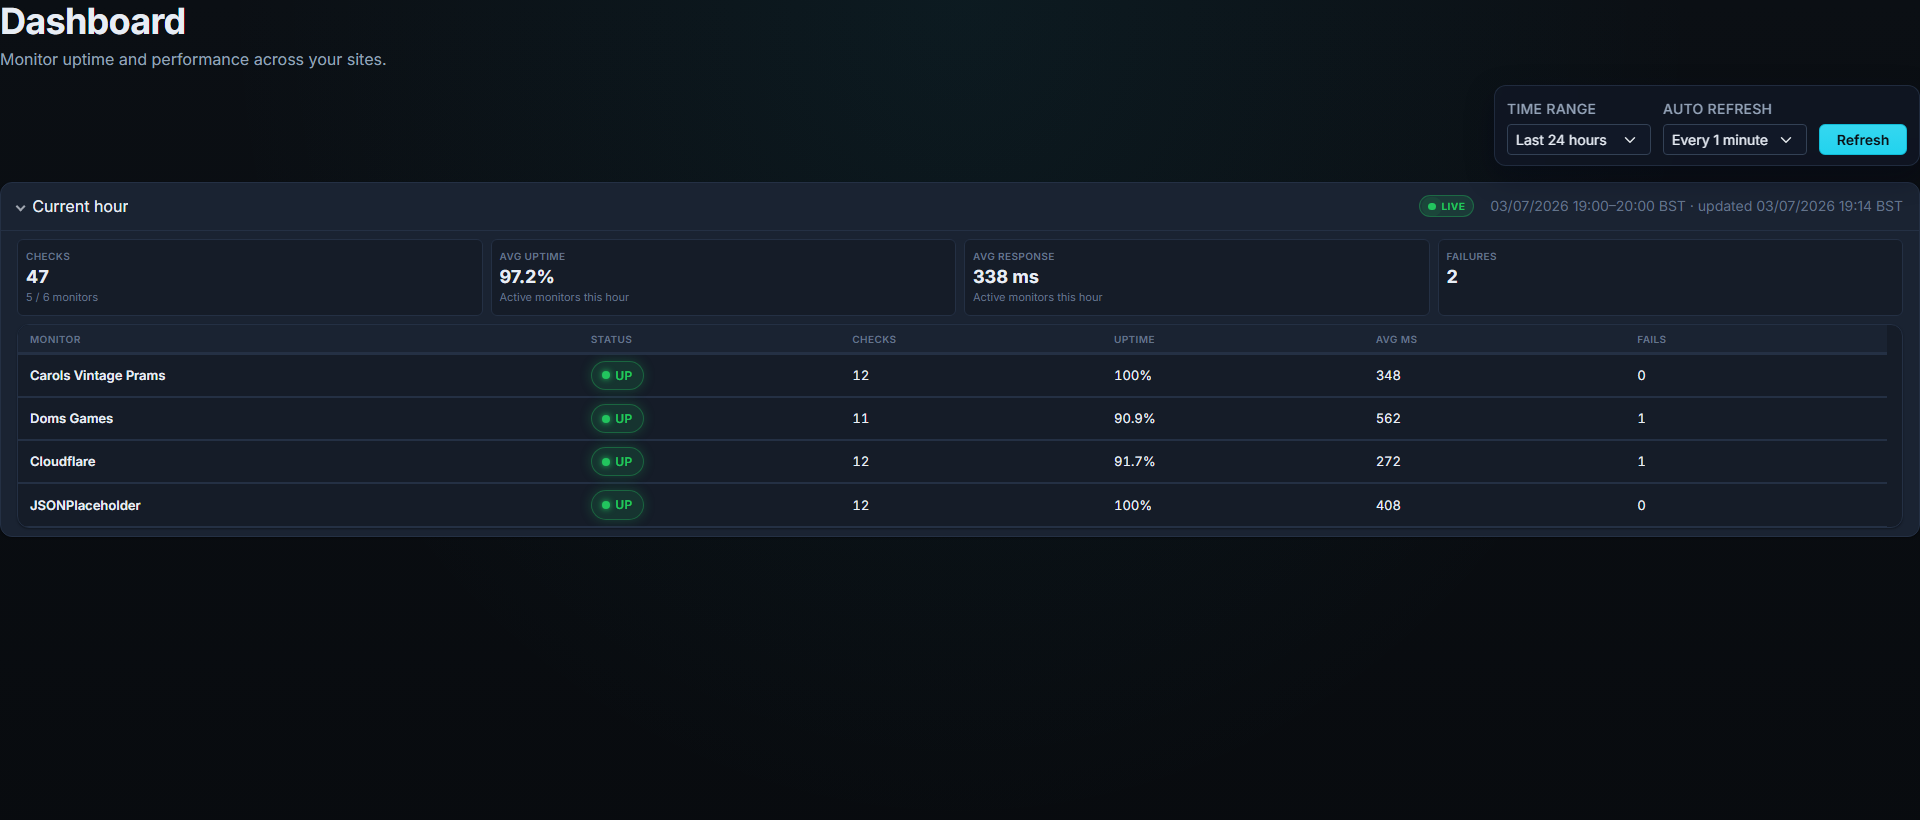
Per-monitor checks, uptime, and failures for the hour in progress- with auto-refresh on Pro and Business.
Paginated downtime history
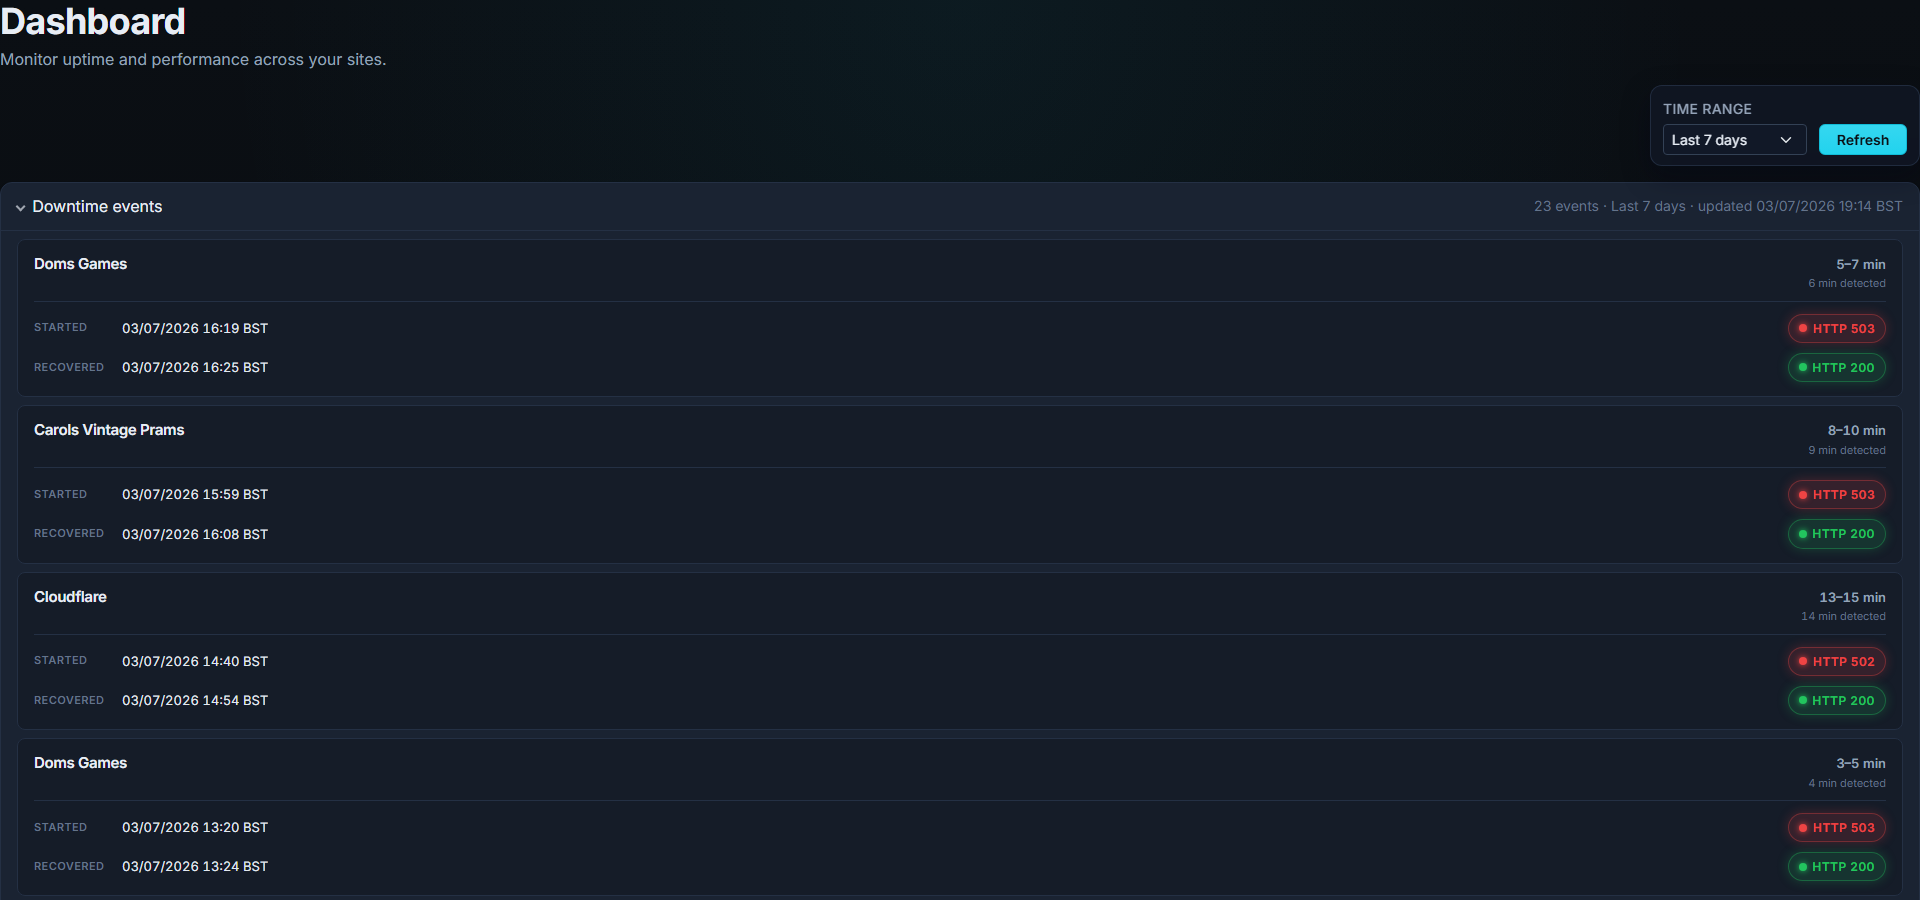
Rich incident cards with duration ranges, HTTP badges, and load-more browsing across monitors.
CSV downtime export
Download downtime events from any monitor in your reporting time zone for reports and post-mortems.
See it with your own sites
Start a 14-day free trial and add your first monitor in minutes.
Compare features or read the
FAQ if you want the full picture first.